Inequality Map

Mobilidade Urbana

People who spend more than one hour to go in their work commute

Use of time in house-work commute. Percentage of the working resident population that takes, on average, more than one hour to arrive at their place of work, independent of the modes used. Data source: Brazilian Institute of Geography and Statistics (IBGE), 2010 Census.

Mobilidade Urbana

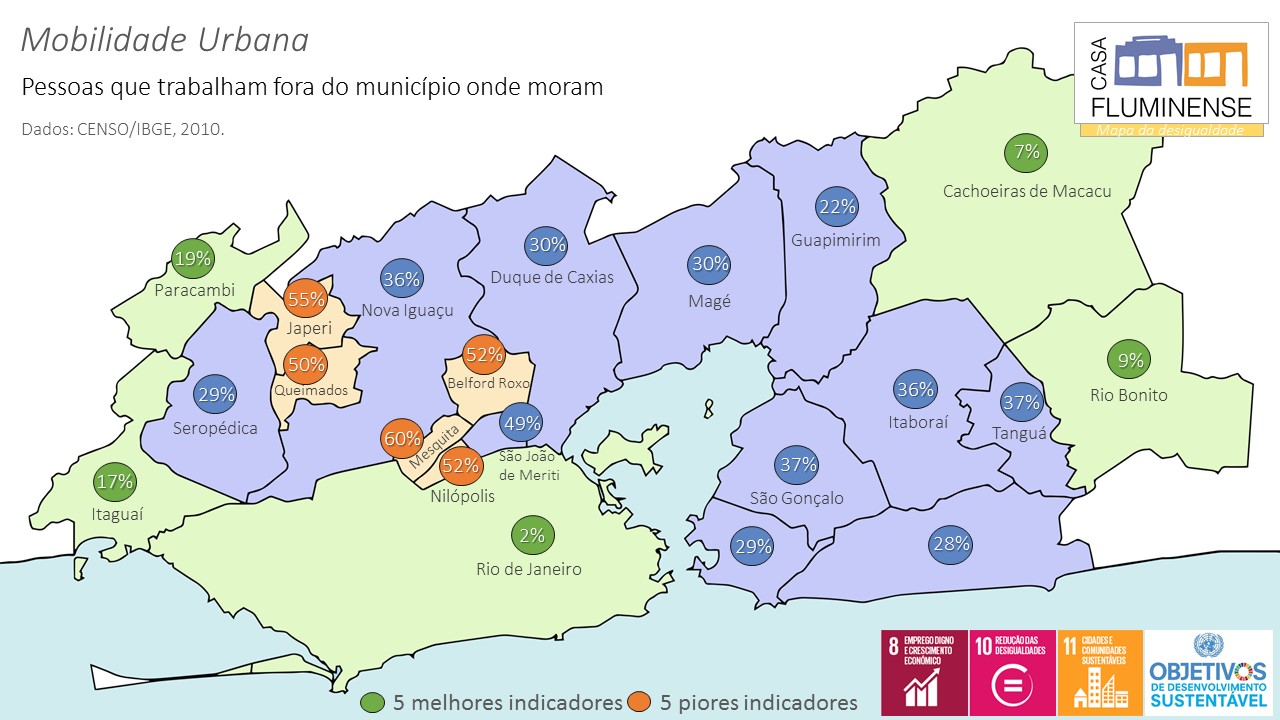
People that work outside of the municipality where they live

Commutes. Percentage of working resident population that works in another municipality and returns home daily. Data source: Brazilian Institute of Geography and Statistics (IBGE), 2010 Census.

Mobilidade Urbana

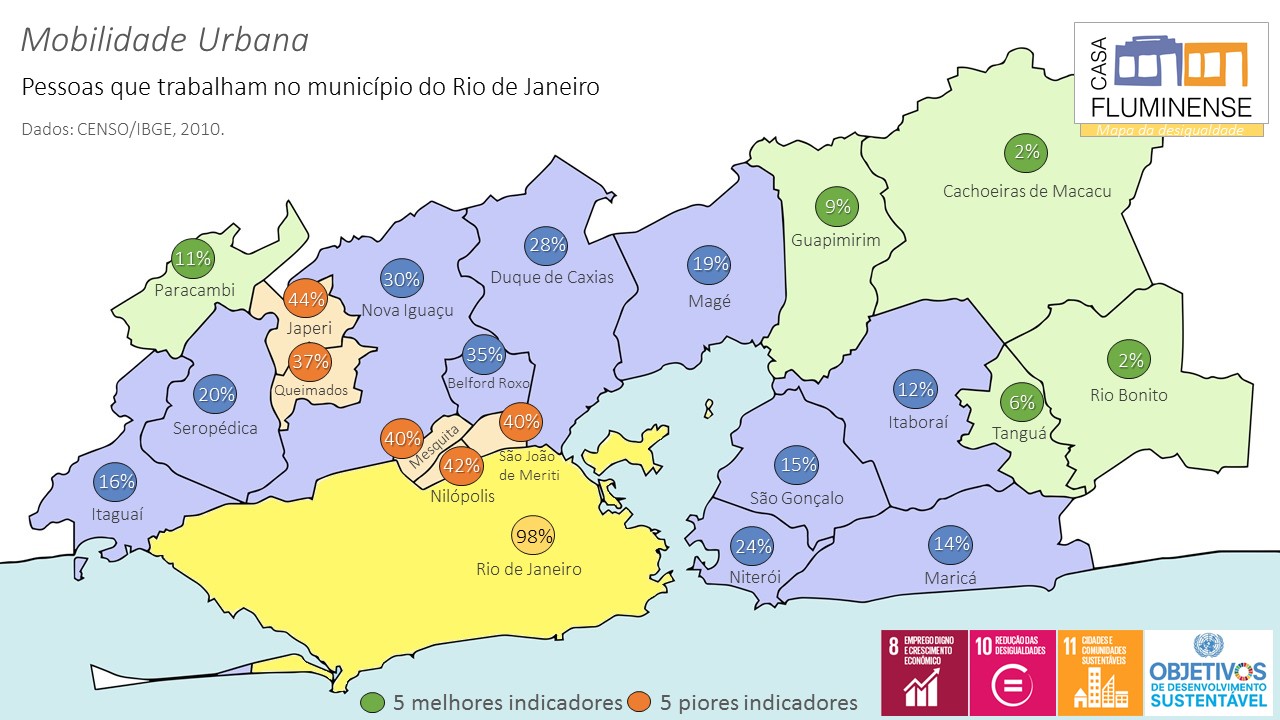
People that work in the municipality of Rio de Janeiro

Centrality of the capital. Percentage of the working resident population that works in the municipality of Rio de Janeiro and returns home daily. Data source: Brazilian Institute of Geography and Statistics (IBGE), 2010 Census.

Mercado de Trabalho

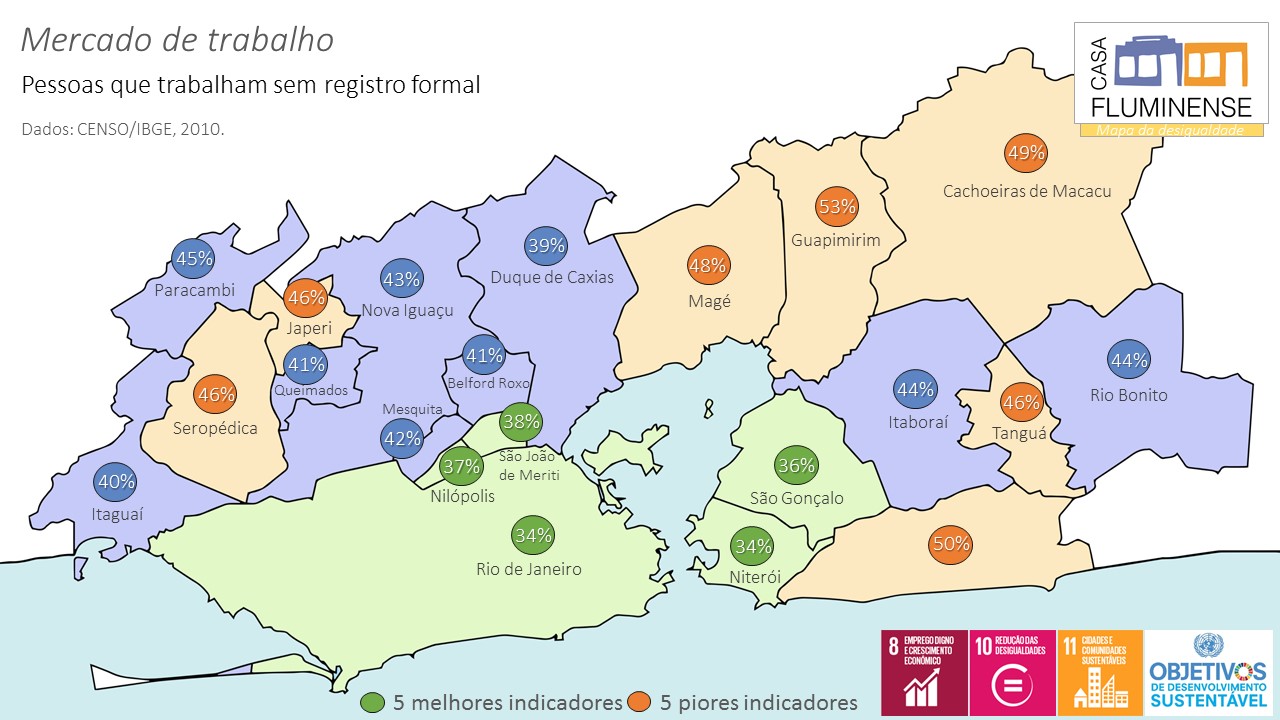
People that work without formal registration

Rate of informality. Percent of the working age population (15 to 70 years-old), residing in the municipality, which works without a signed labour card or are self-employed, without formal registration. Data source: Brazilian Institute of Geography and Statistics (IBGE), 2010 Census.

Mercado de Trabalho

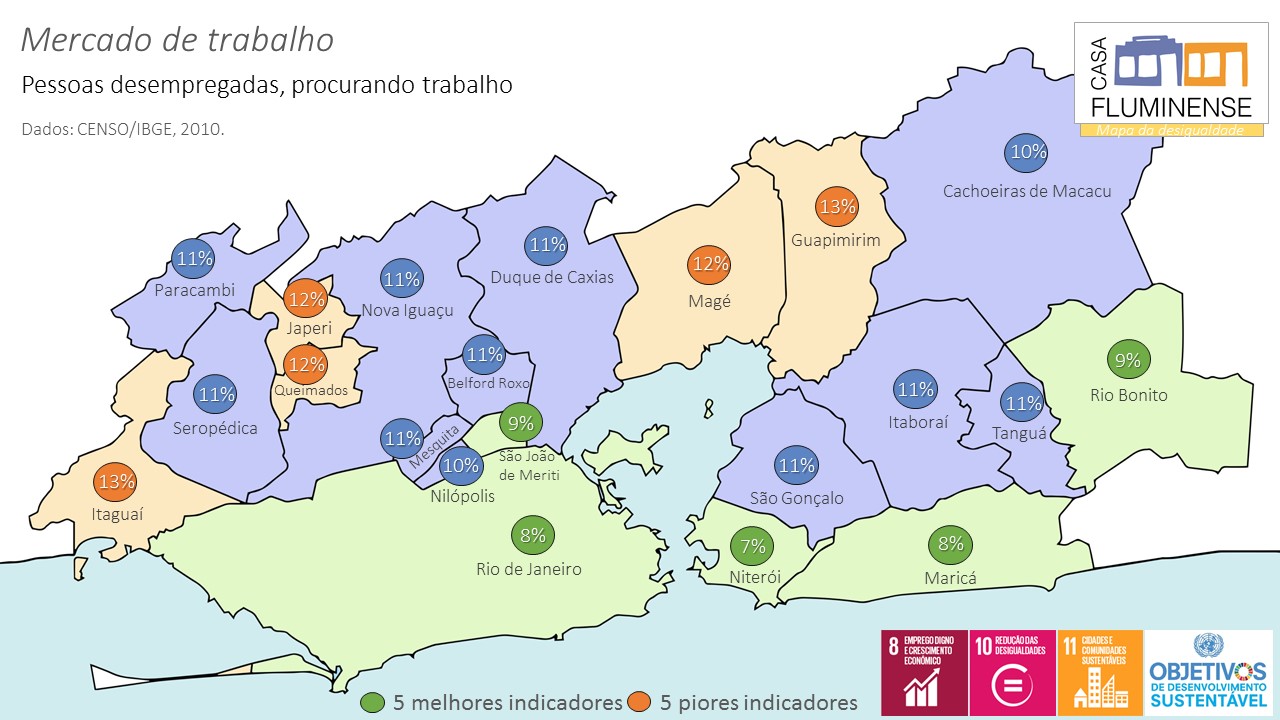
Unemployed people who are looking for work

Unemployment or vacancy rate. Percentage of working ag population (15-70 years-old), residing in the municipality, which finds itself unemployed (informal and formal markets) and claims to be searching for work. Data source: Brazilian Institute of Geography and Statistics (IBGE), 2010 Census.

Mercado de Trabalho

People that do not participate in the job market

Rate of participation in the job market or rate of inactivity. Percentage of the working age population (15 to 70 years), residing in the municipality, which is not involved in any type of paid work and claims not to be searching for work. Data source: Brazilian Institute of Geography and Statistics (IBGE), 2010 Census.

Pobreza e Renda

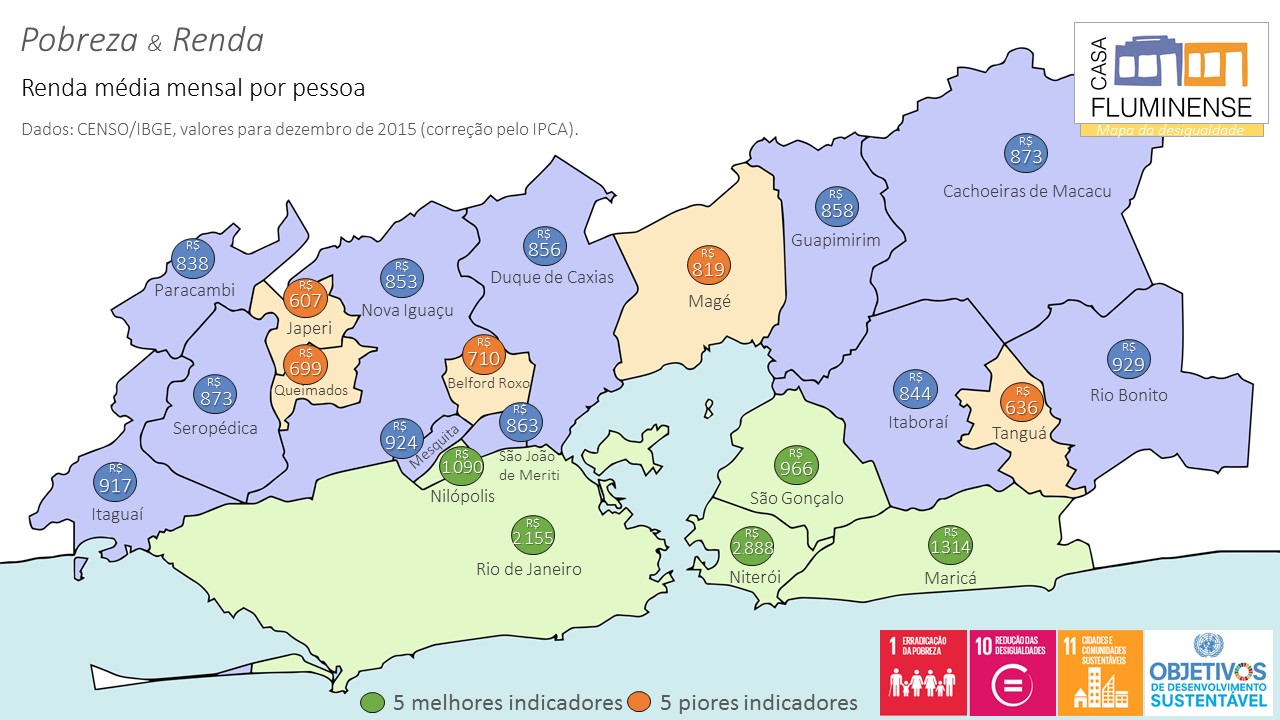
Average monthly income per person

Household income per capita. Total of income earned monthly by one family residing in the municipality, divided by the number of family members. Data source: Brazilian Institute of Geography and Statistics (IBGE), corrected by the Expanded Consumer Prices Index (IPCA), data-base: December 2015.

Pobreza e Renda

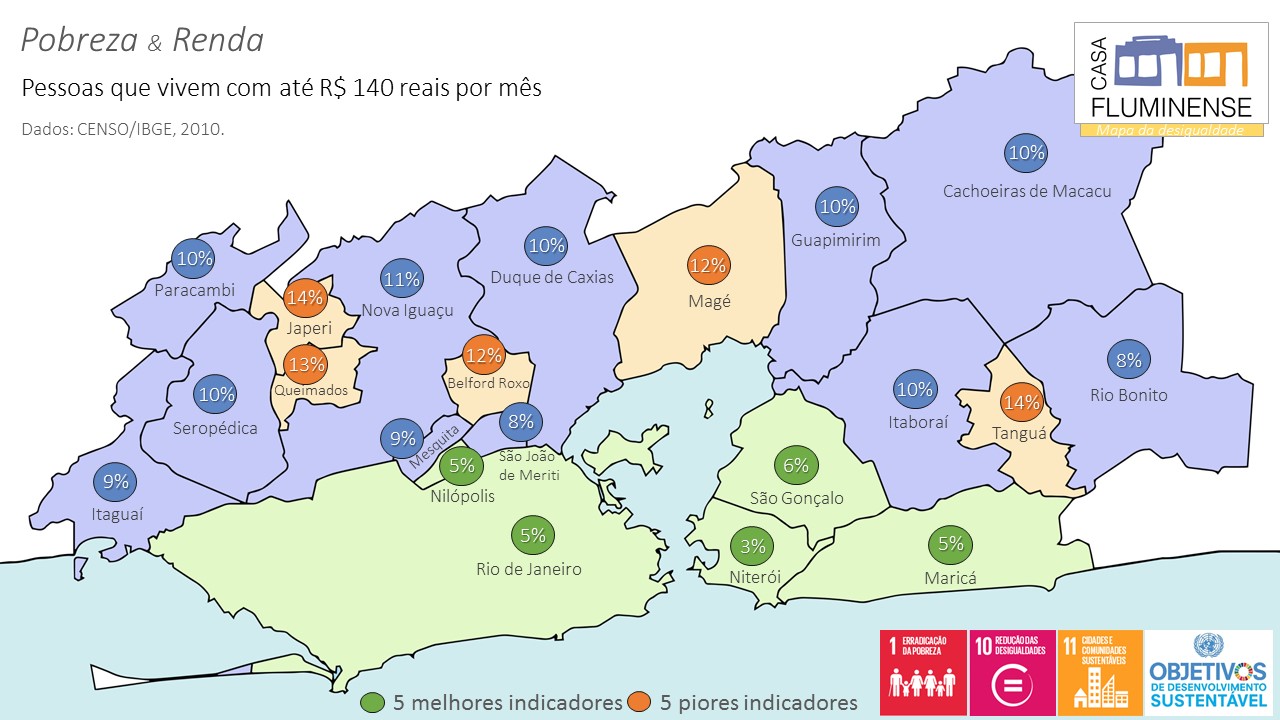
People who live on up to R$140 per month

Poverty rate, vulnerability. Percentage of the population residing in the municipality that lived on up to R$ 140 per month, in 2010. Data source: Brazilian Institute of Geography and Statistics (IBGE), organized by the United Nations Development Programme (UNDP) in the Brazil Atlas, published in 2013.

Pobreza e Renda

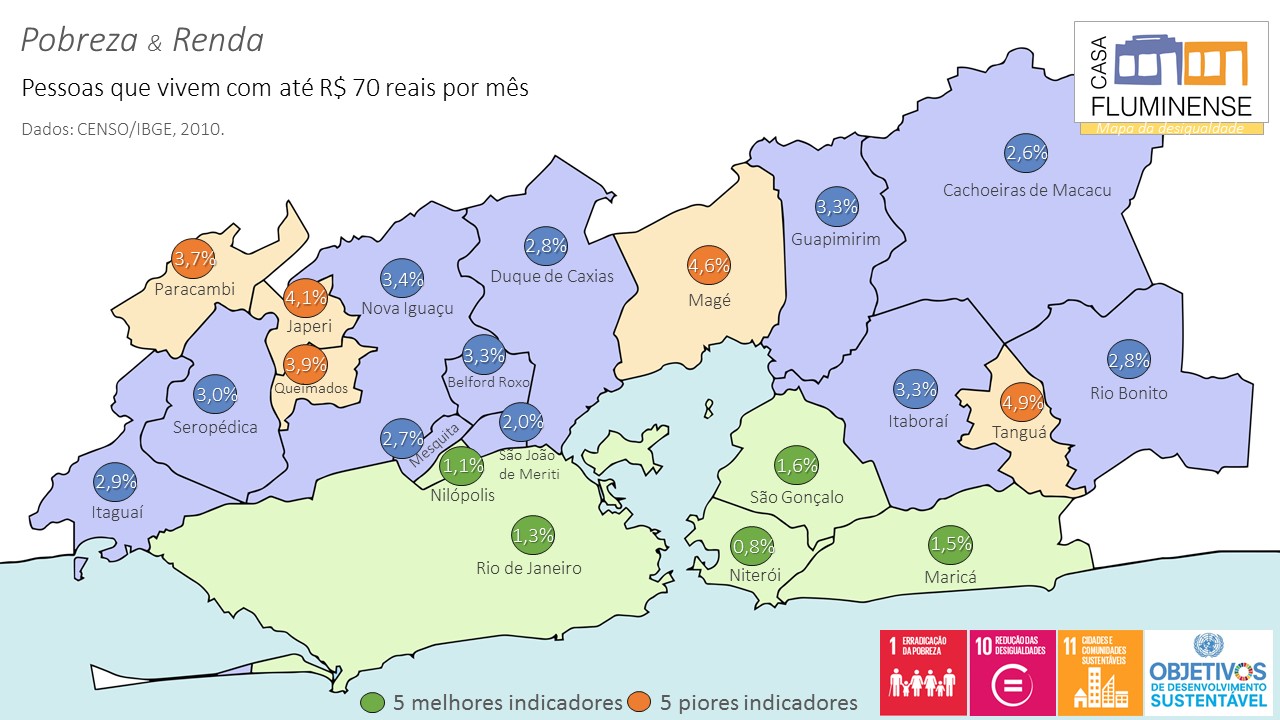
People who live on up to R$70 per month

Extreme poverty rate, destitution. Percentage of the population residing in the municipality that lived on up to R$70 per month, in 2010. Data source: Brazilian Institute of Geography and Statistics (IBGE), organized by the United Nations Development Programme (UNDP) in the Brazil Atlas, published in 2013.

Educação

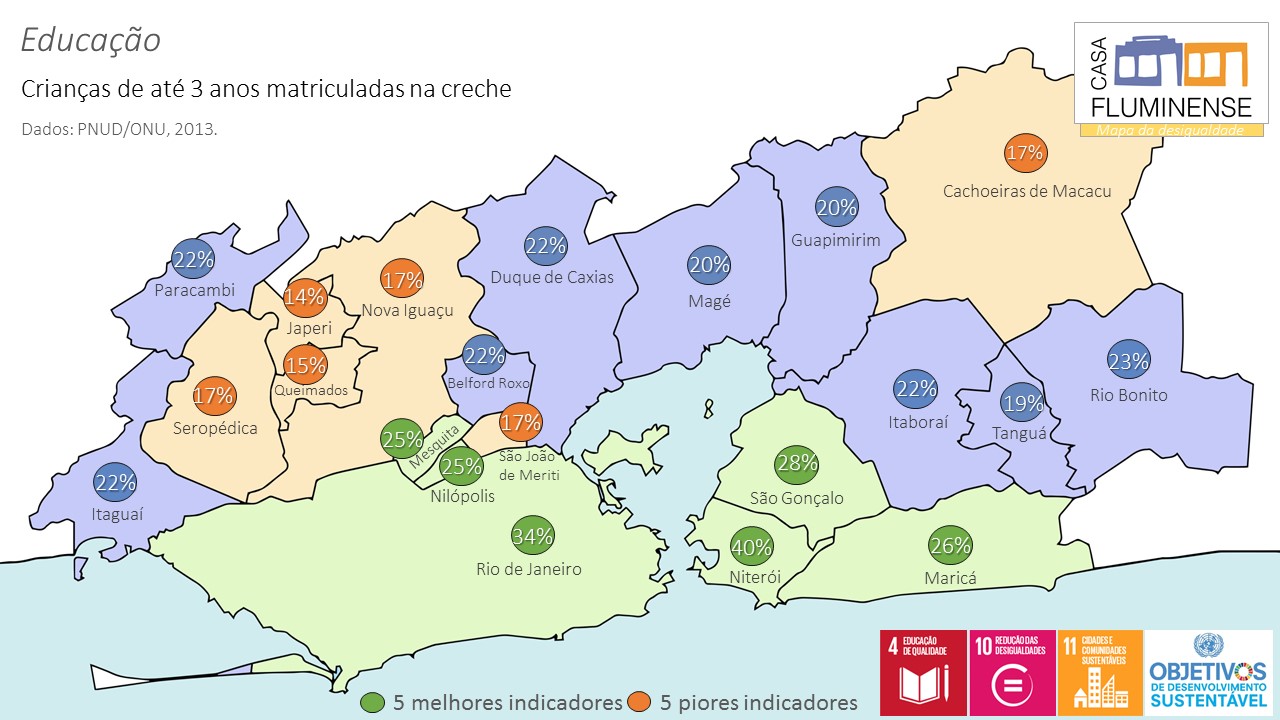
Children of up to 3 years of age enrolled in daycare

Daycare access. Percentage of the population of 0 to 3 years of age, residing in the municipality, which attended school at any level or grade. Data source: 2010 Census conducted by the Brazilian Institute for Geography and Statistics (IGBE), organized by the United Nations Development Programme (UNDP), in the Brazil Atlas, published in 2013.

Educação

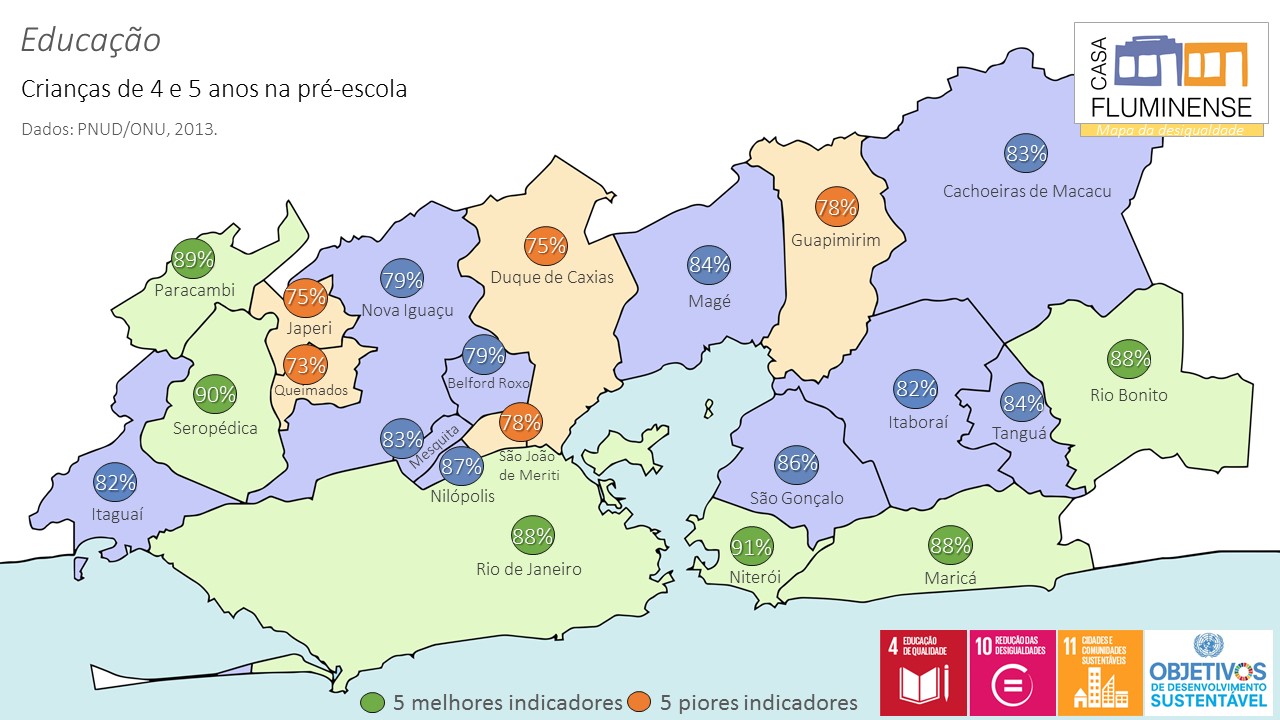
Children of 4-5 years of age in pre-school

Access to pre-school. Percentage of the population of 4 to 5 years of age, residing in the municipality, which was attending a school in any level or grade. Data source: 2010 Census conducted by the Brazilian Institute for Geography and Statistics (IGBE), organized by the United Nations Development Programme (UNDP), in the Brazil Atlas, published in 2013.

Educação

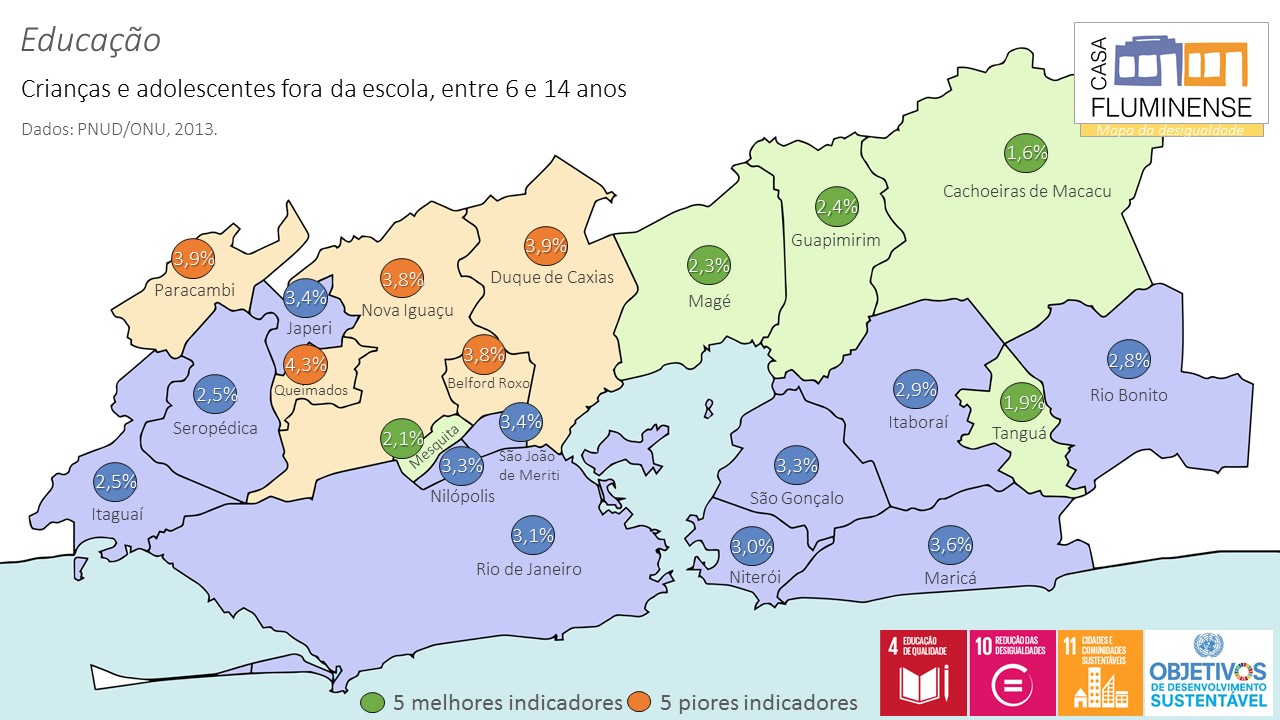
Children and adolescents out of school, between 6 and 14 years of age

Rate of school evasion. Percentage of the population between 6 and 14 years of age, residing in the municipality, which was not attending school at any level or grade. Data source: 2010 Census conducted by the Brazilian Institute for Geography and Statistics (IGBE), organized by the United Nations Development Programme (UNDP), in the Brazil Atlas, published in 2013.

Educação

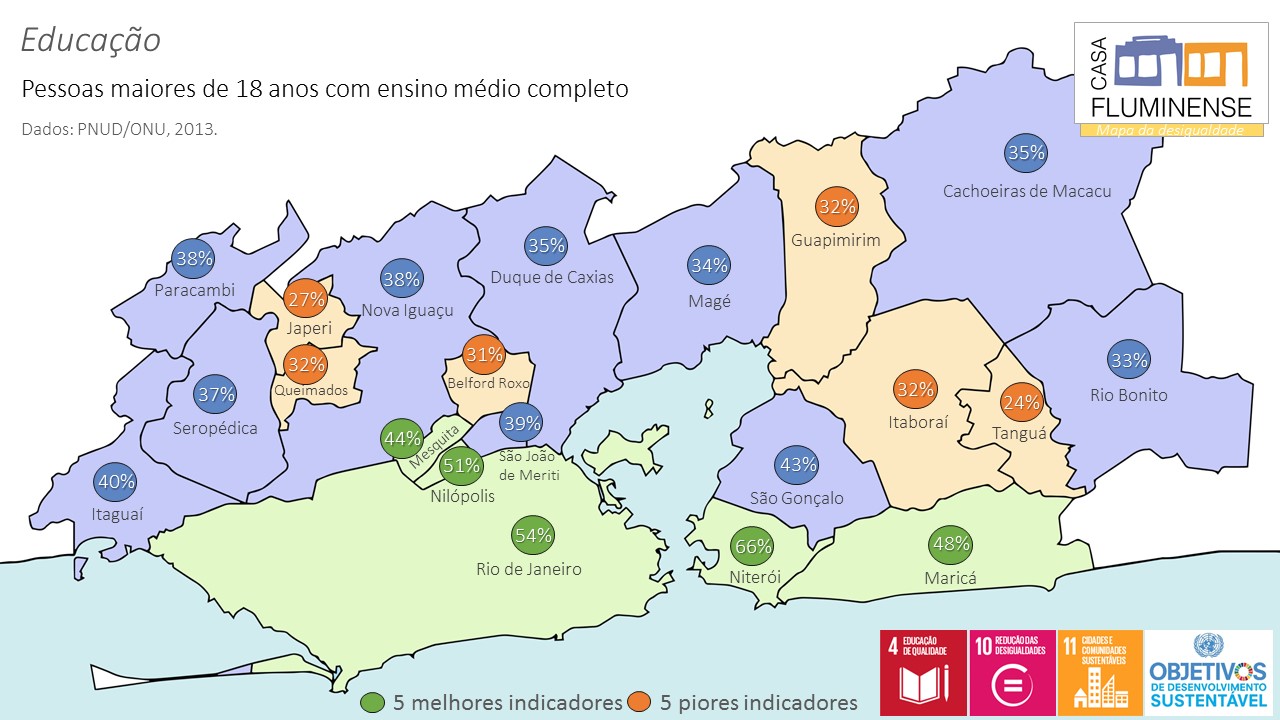
People older than 18 years of age that completed high school

Schooling and training. Percentage of the population 18 years or older, residing in the municipality, which completed high school, in any form (in a regular sequence, not in a sequence, Education of Youth and Adults – EJA, or supplementary education). Data source: 2010 Census conducted by the Brazilian Institute for Geography and Statistics (IGBE), organized by the United Nations Development Programme (UNDP), in the Brazil Atlas, published in 2013.

Educação

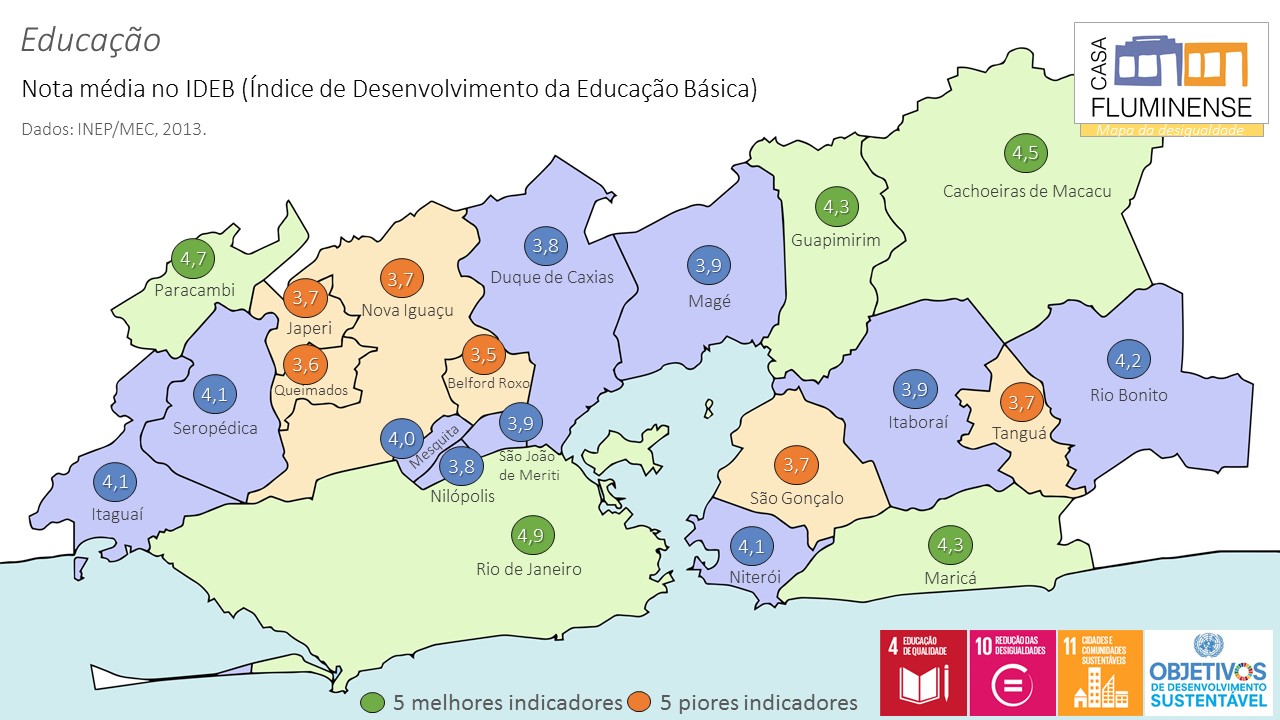
Average IDEB (Development and Basic Education Index) grade

Quality of Instruction. Average among the results of the initial and final series of public schools located in the municipality. The 2013 IDEB was calculated based on the performance of students that participated in the 2013 Brazil/Saeb test and the pass rates, calculated on the basis of information provided by the 2013 School Census. Data source: Anísio Teixeira National Institute of Educational and Research (INEP), of the Ministry of Education, base-year: 2013.

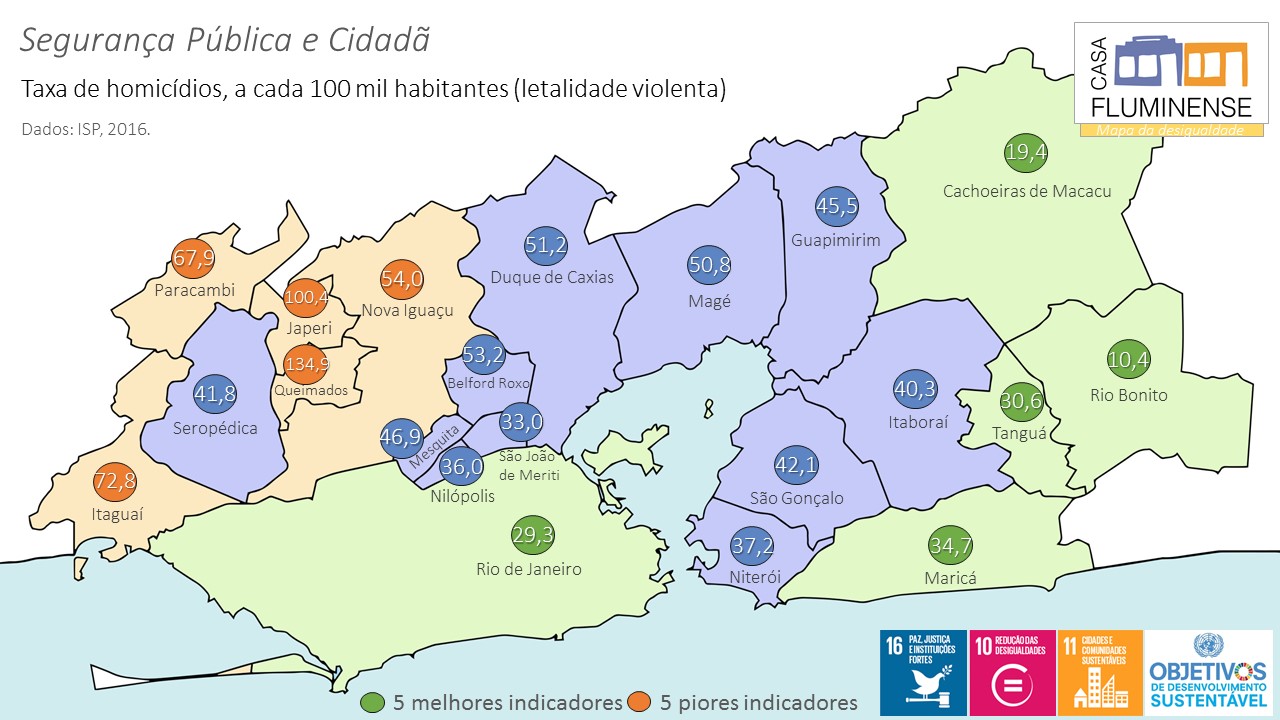
Segurança Pública e Cidadã

Homicide rate, for every 100 thousand inhabitants (violent lethality)

Violent lethality. Corresponding to the sum total of the number of premeditated homicides, robbery followed by killing (armed robbery), bodily injury followed by death, homicides resulting from resistance to police intervention, divided by the resident population. Multiplied by 100 thousand to obtain the comparable rate. Data source: Portal of the Public Safety Institute (ISP), connected to the Department of Public Safety of the government of the state of Rio de Janeiro, base-year 2016.

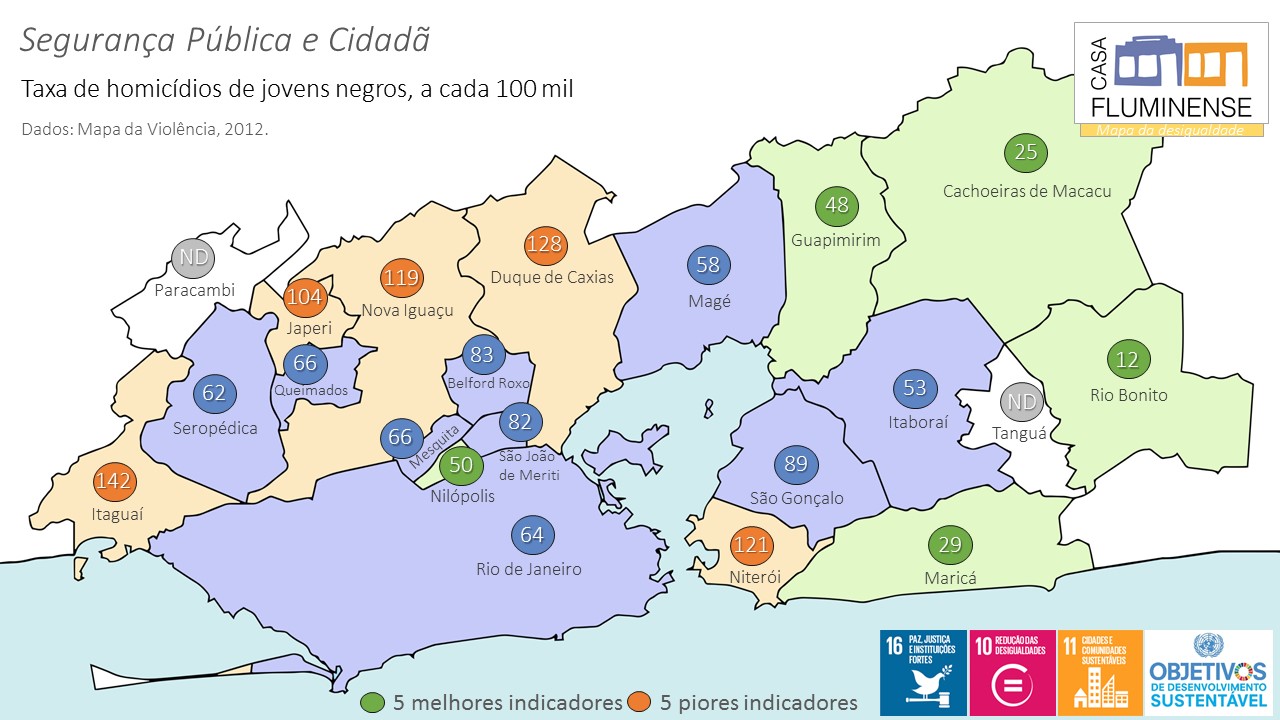
Segurança Pública e Cidadã

Homicide rate of black youth, for every 100 thousand inhabitants

Violence against black youth. Number of first-degree murders of black (and mixed-race) youth (between the ages of 15 and 29) that occurred in the municipality divided by the total of young black residents of the municipality. Multiplied by 100 thousand to obtain a comparable rate. Date source: Violence Map 2014 of the Latin American Social Sciences Institute, Flacso-Brazil, base-year: 2012.

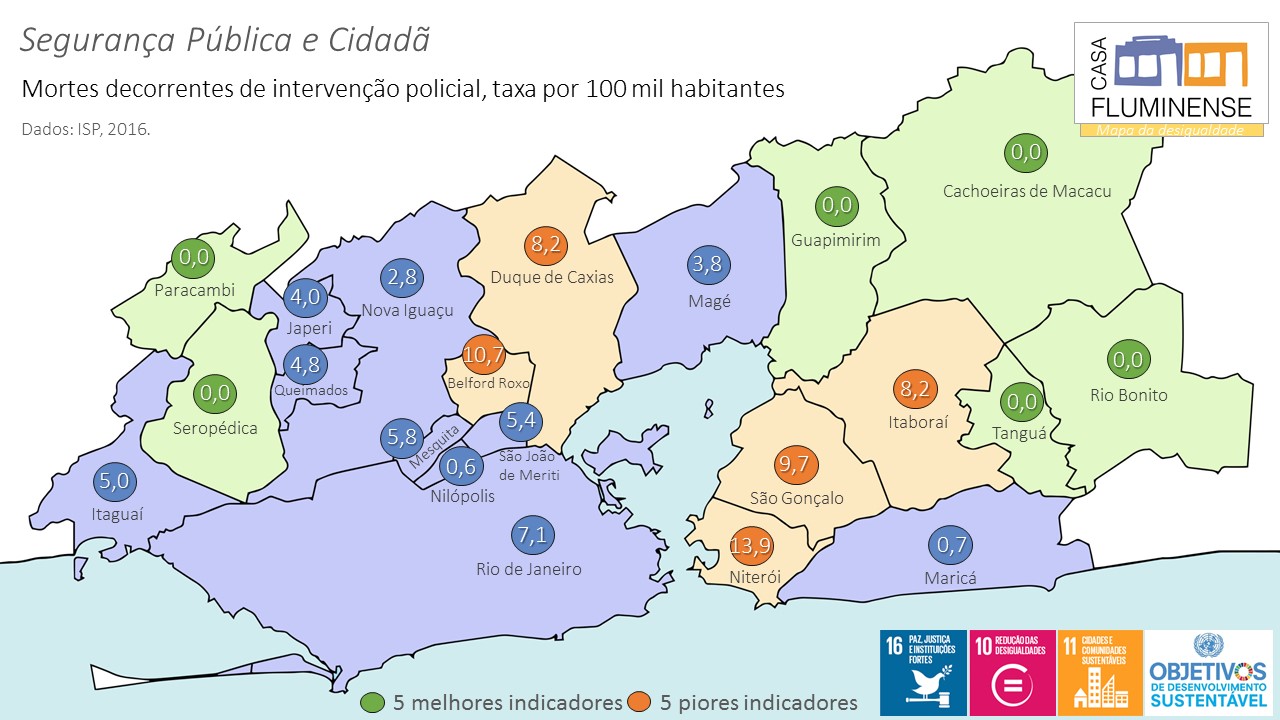
Segurança Pública e Cidadã

Deaths resulting from police intervention, rate by 100 thousand inhabitants

Acts of “legitimate self-defense.” Number of homicides committed by police officrs in the municipality, divided by the resident population. Multiplied by 100 thousand to obtain a comparable rate. Data source: Portal of the Public Safety Institute (ISP), connected to the Department of Public Safety of the government of the state of Rio de Janeiro, base-year 2016.

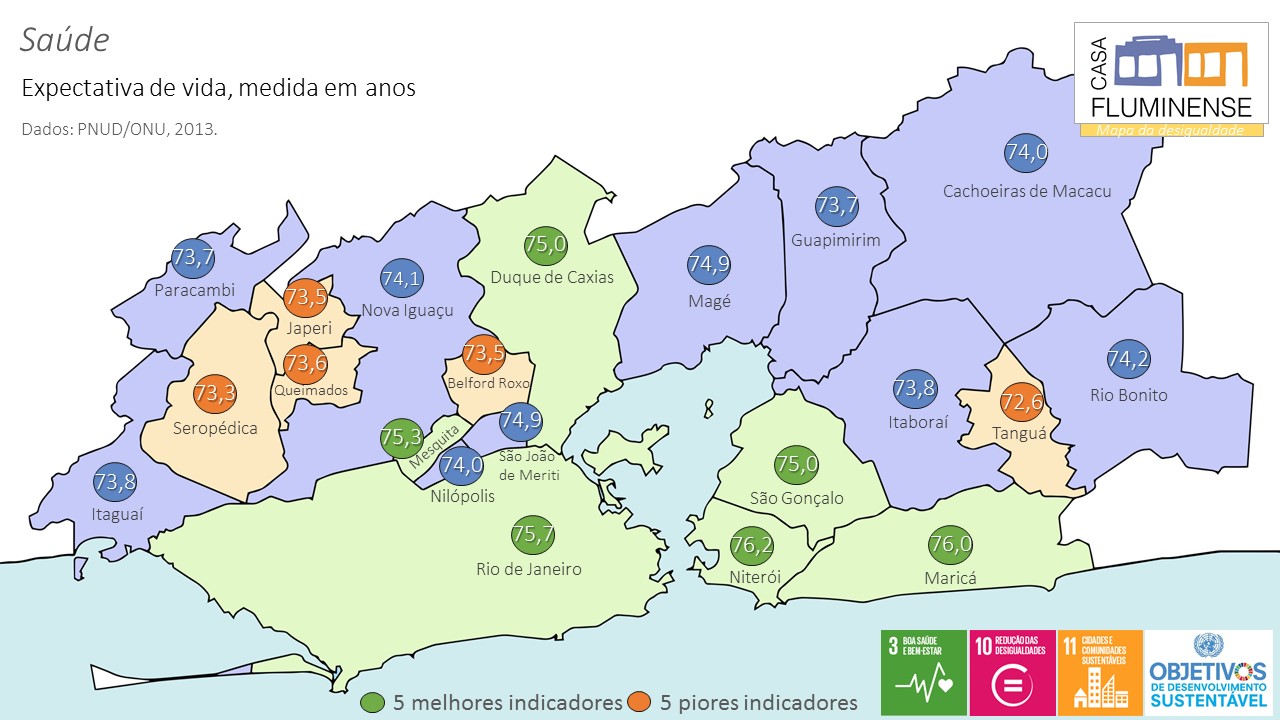
Saúde

Life expectancy, measured in years

Life expectancy upon birth. Average number in years that the resident population of the municipality should reach, taking into account the level and pattern of mortality by age, prevailing in the 2010 Census of the IBGE. Data source: The United Nations Development Programme (UNDP), in the Brazil Atlas, published in 2013.

Saúde

Adolescent pregnancy, 15 to 17 years of age

Percentage of women between the ages of 15 and 17 that are municipality residents and already had a child. Data source: 2010 Census of the IBGE, organized by the United Nations Development Programme (UNDP), in the Brazil Atlas, published in 2013.

Saúde

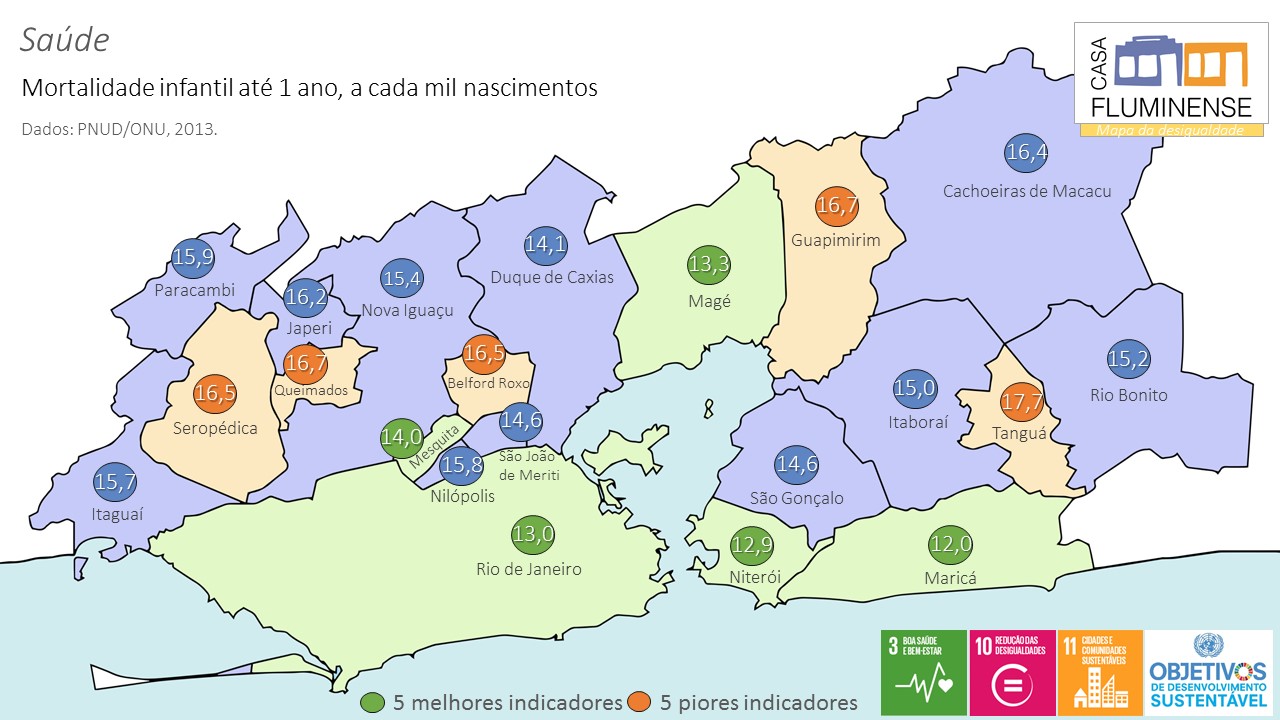
Infant mortality, for each thousand births

Mortality rate up until one year of age. Average number of children that do not survive the first year of life out of every 1,000 children born alive, taking into account the level and pattern of infant mortality, prevailing in the 2010 Census of the IBGE. Data source: The United Nations Development Programme (UNDP), in the Brazil Atlas, published in 2013.

Saneamento Básico

People served by the sewage system

Sewage collection. Percentage of the total municipality resident population whose residence is connected to the sewage system, attended to by the service provider. Date source: National System of Information about Sanitation (SNIS), connected to the Ministry of Cities (MCidades), base-year: 2014.

Saneamento Básico

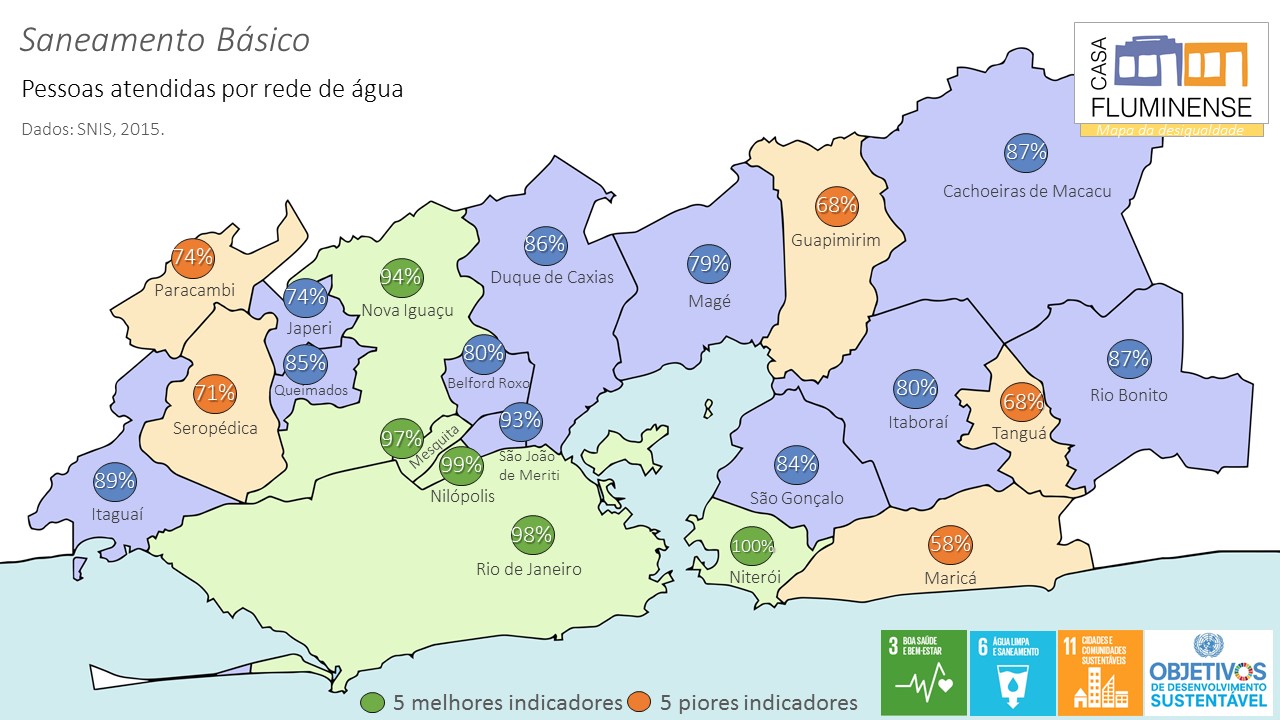
People served by a water system

Water supply. Percentage of the total municipality resident population whose residence is connected to active water conservation, attended to by the service provider. Date source: National System of Information about Sanitation (SNIS), connected to the Ministry of Cities (MCidades), base-year: 2014.

Saneamento Básico

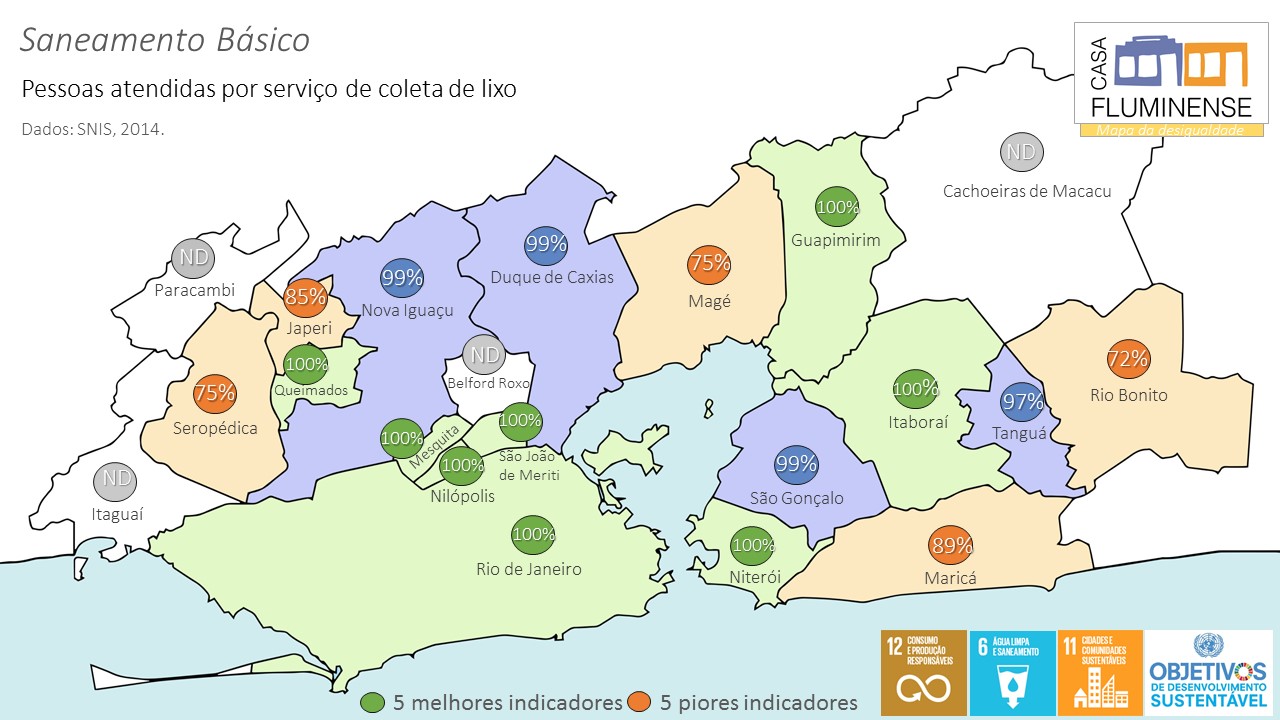
People served by a trash collection system

Solid waste. Percentage of the total municipality resident population that is served by trash separation and proper final trash disposal. Date source: National System of Information about Sanitation (SNIS), connected to the Ministry of Cities (MCidades), base-year: 2014)

The Inequality Map gathers 23 indicators on seven key themes related to the metropolitan reality of Rio de Janeiro: Mobility, Job Market, Poverty and Income, Education, Public and Citizen Safety, Health and Basic Sanitation. The data is updated according to the most recent publications of official sources.

The maps show the different patterns in the lives of the 12 million residents in the 21 municipalities that constitute the Metropolitan Region of Rio de Janeiro (RMRJ). One of the purposes of this exercise is to promote a metropolitan gaze towards transversal issues and to understand the situation of each citizen in this context.

With this, Casa seeks to fill a gap in terms of spreading public information. Expanding the reach of knowledge about these issues and making data and information reader-friendly helps to qualify public debates. Our goals are the deepening of democracy, the promotion of territorial equality, and sustainable development.

Make use of the maps!